How the work is tracked
At the scale Atlex operates, cull data has to be current. Cull rates, species patterns, and behavioural shifts need to be visible while there is still time to act on them.
Small scale deer stalking can work well on memory, knowledge of the land, and a larder notebook. One stalker, modest numbers. Records mainly meet legislative requirements and document the season's cull.
That changes when the work moves from routine control to a defined cull at scale. Land is worked more intensively. Night licences may be in use, with specific digital reporting required by Natural England. More people are involved. The deer themselves respond. They become warier, more nocturnal, and less predictable. Routes change. Animals may move onto neighbouring land, or hold in sanctuary areas where they can't be culled.
What works at low intensity becomes insufficient. The gap between what is happening on the land and what anyone can keep in their head widens quickly. More carcasses need extracting. Chiller space, game dealer collections, and carcass deliveries need to be coordinated. Stalkers need a shared picture of where deer have been culled. Time spent on land that has recently been stalked is wasted effort.
This is the environment a defined cull operates in.
How the systems evolved
The Atlex way of working was not bought off the shelf. It evolved over several seasons of cull work.
Early on, records were captured through Google Forms feeding into spreadsheets. That was serviceable, but limited. Over time, records moved into web and app based systems better suited to the work. That reduced friction for stalkers entering data and made the records more consistent, more complete, and more useful. Every cull is logged at the point it happens, while the detail is still accurate, against the same fields each time.
The aim has never been technology for its own sake. The aim has been less time on admin and more usable information when it matters. The systems developed because larger culls outgrew a static spreadsheet. They are there to support the work and help the team operate more efficiently.
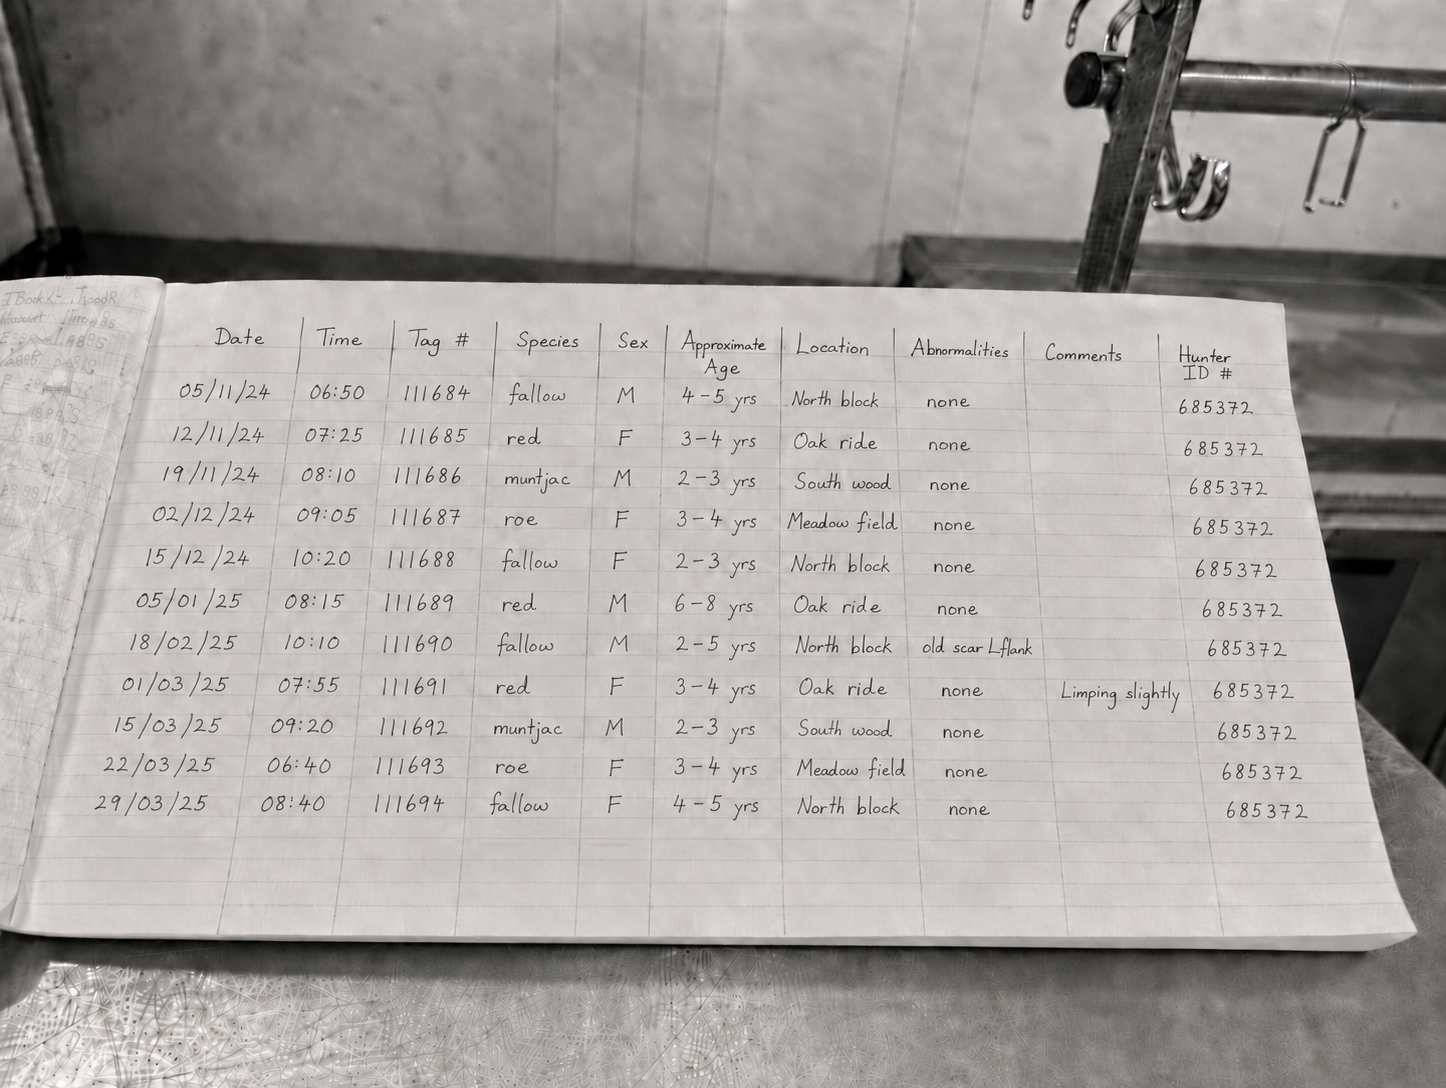
What is recorded
Each cull record starts at the point of cull and is completed as the carcass moves through handling and into the chiller. That record provides the traceability required for carcasses entering the food chain and forms the working dataset for the season.
The record covers:
- Species
- Sex
- Date and time of cull
- GPS location
- Cull type, daytime or night licence, A16 / CL55
- Trained Hunter ID
- Carcass weight
- Projectile impact location
- Condition notes, including abnormalities or signs of disease
- Chiller entry
Where the cull is carried out under a WS1 deer control requirement, WD2 woodland improvement condition, or similar grant obligation, these records provide the documented evidence of reduction activity that those schemes require.
How the data shapes decisions during the cull
Cull rate, measured as culls per active day, shows whether the work is still producing results and how deer are responding to pressure. As the season progresses, animals become warier, shift their patterns, or redistribute across the land. Tracking that change is what shows when the approach needs to adapt.
This season, the initial fallow rate ran at around eleven culls per active day. When that rate began to fall consistently, it showed the deer were responding to daytime pressure. The work then moved to operating the night licence alongside daytime culling, and the rate recovered. That kind of adjustment depends on timely, consistent data. Without it, the decision to change approach rests more on impression than evidence.
The same data shows what happens when an area is rested before being worked again, how deer move under pressure, how quickly the rate rebuilds when culling resumes, and what that means for the next phase of work. Over time, it builds a clearer picture of species specific behaviour on that land. It also gives a firmer basis for judging how the same species is likely to behave on other land.
Carcass records also support chiller management throughout the season. They show what is in the chiller, when it needs clearing, and help keep the work moving without a backlog. The same records carry the weight and condition detail a game dealer requires for every animal entering the food chain, in a usable digital form rather than left only on a handwritten carcass tag.
Output figures
Daily cull rate
Solo
Average 4.1 deer per active day across 13 solo days, with a daily peak above 10.
Team
Average 11.8 deer per active day across 29 team days, with two to six stalkers. Days above 20 when conditions allow.
Cull effort
Averaged 2.6 hours per deer in 2024/25 and 2.1 hours per deer in 2025/26. More than 90% of these culls were fallow, the species most heavily concentrated in herds and the one that places the greatest demand on coordinated team work.
What the landowner receives
The landowner has direct access to a live dashboard throughout the cull. Culls appear as they are logged, so progress can be seen while the season is still underway, not pieced together afterwards. By the end of the season, the same dashboard holds a complete factual record of the work, including cull totals by species, sex, and period, ready to be reviewed, shared with an adviser or agent, and used as the basis for the next decision on the land.
Season summary
At the end of each season, the full dataset is reviewed. Cull totals, effort figures, spatial distribution, and rate changes across the season are drawn together into an end of season summary. That summary is provided to the landowner and used to inform how the following season is planned.
Where a pre cull census or baseline survey is available, the summary compares pre cull and post cull numbers to show the net reduction achieved across the season. Repeated over several seasons, the same comparison shows patterns of infill and recruitment, how quickly the population rebuilds under sustained pressure, and what that means for setting the next season's reduction target on evidence rather than assumption.
26 March 2026
Total culls
473
Fallow
423
89%
Muntjac
50
11%
Night licence
19%
92 culls
Cumulative culls — 2025/26
Weekly cull rate — culls per active day
Daytime cull vs night licence by week
2025/26 season. 1 November 2025 to 26 March 2026. Wild deer only. Data aggregated to weekly totals. Individual cull locations and operator details are not shown.
The same data that drives decisions during the season is what the landowner is left with at the end of it. A complete record of what was done, what it achieved, and a firmer basis for what comes next.